Building a WiFi Weather Station with ESP32 and BME280
Ever wanted your own personal weather station — one that shows live data on a tiny OLED screen and also serves a web dashboard you can pull up on your phone from anywhere in your house? In this tutorial, we will build exactly that using an ESP32 microcontroller and the BME280 environmental sensor.
By the end of this project, you will have a fully working weather station that:
- Reads temperature, humidity, and barometric pressure in real time
- Displays readings on a 0.96" OLED screen
- Hosts a WiFi web dashboard with auto-refresh and a simple trend graph
- Logs data to LittleFS on the ESP32's flash memory
- Predicts basic weather trends from pressure changes
No cloud services required. No subscriptions. Just a few components, some C++ code, and about two hours of your time.
Components You Will Need
Here is everything required for this project. All components are available at wavtron.in.
| Component | Description | Approx. Price |
|---|---|---|
| ESP32 DevKit V1 (30-pin) | WiFi + Bluetooth microcontroller | ~₹450 |
| BME280 sensor module | Temperature, humidity, pressure (I2C) | ~₹250 |
| SSD1306 OLED display (0.96", I2C) | 128x64 pixel monochrome display | ~₹180 |
| Half-size breadboard | For prototyping connections | ~₹40 |
| Jumper wires (M-M) | At least 8 wires | ~₹30 |
| Micro-USB cable | For programming and power | ~₹50 |
Total cost: approximately ₹1,000
That is a complete, internet-connected weather station for under a thousand rupees. Not bad at all.
Understanding the BME280 Sensor
The BME280 from Bosch is one of the most popular environmental sensors in the maker world, and for good reason. It packs three sensors into a single tiny package:
- Temperature: -40 to +85 degrees C, accuracy of plus or minus 1 degree C
- Humidity: 0 to 100% RH, accuracy of plus or minus 3% RH
- Barometric Pressure: 300 to 1100 hPa, accuracy of plus or minus 1 hPa
It communicates over I2C (default address 0x76 or 0x77 depending on the module) and draws very little power — under 4 microamps in normal mode. The module you will find at most Indian electronics stores comes on a small breakout board with a voltage regulator and level shifting, so it works perfectly with the ESP32's 3.3V logic.
Important: Do not confuse the BME280 with the BMP280. The BMP280 measures only temperature and pressure — it lacks the humidity sensor. Check the markings on your module carefully.
Wiring Diagram
Both the BME280 and the SSD1306 OLED communicate over I2C, which means they can share the same two data lines. This makes wiring very simple — just four connections per device, and two of those lines are shared.
Connections
| ESP32 Pin | BME280 Pin | SSD1306 OLED Pin | Function |
|---|---|---|---|
| 3V3 | VIN (or VCC) | VCC | Power (3.3V) |
| GND | GND | GND | Ground |
| GPIO 21 (SDA) | SDA | SDA | I2C Data |
| GPIO 22 (SCL) | SCL | SCL | I2C Clock |
That is it. Both devices sit on the same I2C bus. The BME280 defaults to address 0x76 and the OLED defaults to 0x3C, so there is no conflict.
Wiring tips:
- Keep the I2C wires short — under 20 cm ideally. Long wires can introduce noise.
- If your BME280 module has a CS pin, leave it unconnected (or tie it to VCC) to keep the module in I2C mode.
- Double-check your OLED module's pinout. Some modules have VCC and GND swapped compared to others.
Setting Up the Arduino IDE
Before we write any code, install the required board support and libraries.
1. Add ESP32 Board Support
If you have not already, add the ESP32 boards to Arduino IDE:
- Go to File > Preferences
- In "Additional Board Manager URLs", add:
https://raw.githubusercontent.com/espressif/arduino-esp32/gh-pages/package_esp32_index.json - Go to Tools > Board > Board Manager, search for "ESP32", and install esp32 by Espressif Systems
- Select ESP32 Dev Module from the board menu
2. Install Libraries
Go to Sketch > Include Library > Manage Libraries and install the following:
| Library | Author | Purpose |
|---|---|---|
| Adafruit BME280 Library | Adafruit | Reading the BME280 sensor |
| Adafruit Unified Sensor | Adafruit | Dependency for BME280 library |
| Adafruit SSD1306 | Adafruit | Driving the OLED display |
| Adafruit GFX Library | Adafruit | Graphics primitives for the OLED |
The Adafruit BME280 library will prompt you to install its dependencies automatically — accept all of them.
Step 1: Reading the BME280 Sensor
Let us start simple. This sketch reads the BME280 and prints values to the Serial Monitor.
#include <Wire.h>
#include <Adafruit_Sensor.h>
#include <Adafruit_BME280.h>

Adafruit_BME280 bme;

void setup() {
  Serial.begin(115200);
  delay(1000);

  if (!bme.begin(0x76)) {
    Serial.println("Could not find BME280 sensor! Check wiring.");
    while (1) delay(10);
  }

  Serial.println("BME280 found. Reading values...");
}

void loop() {
  float temperature = bme.readTemperature();       // Celsius
  float humidity    = bme.readHumidity();           // % RH
  float pressure    = bme.readPressure() / 100.0F;  // hPa

  Serial.printf("Temp: %.1f C  |  Humidity: %.1f %%  |  Pressure: %.1f hPa\n",
                temperature, humidity, pressure);

  delay(2000);
}
Upload this sketch, open the Serial Monitor at 115200 baud, and you should see live readings. If you see "Could not find BME280 sensor", try changing the address from 0x76 to 0x77.
Step 2: Displaying on the OLED
Now let us add the OLED display for a self-contained readout.
#include <Wire.h>
#include <Adafruit_Sensor.h>
#include <Adafruit_BME280.h>
#include <Adafruit_GFX.h>
#include <Adafruit_SSD1306.h>

#define SCREEN_WIDTH 128
#define SCREEN_HEIGHT 64
#define OLED_RESET -1

Adafruit_SSD1306 display(SCREEN_WIDTH, SCREEN_HEIGHT, &Wire, OLED_RESET);
Adafruit_BME280 bme;

void setup() {
  Serial.begin(115200);

  if (!display.begin(SSD1306_SWITCHCAPVCC, 0x3C)) {
    Serial.println("SSD1306 allocation failed");
    while (1) delay(10);
  }

  if (!bme.begin(0x76)) {
    Serial.println("BME280 not found");
    while (1) delay(10);
  }

  display.clearDisplay();
  display.setTextColor(SSD1306_WHITE);
  display.display();
}

void loop() {
  float temp     = bme.readTemperature();
  float humidity = bme.readHumidity();
  float pressure = bme.readPressure() / 100.0F;

  display.clearDisplay();

  // Header
  display.setTextSize(1);
  display.setCursor(20, 0);
  display.print("WEATHER STATION");

  // Divider line
  display.drawLine(0, 10, 128, 10, SSD1306_WHITE);

  // Temperature - large font
  display.setTextSize(2);
  display.setCursor(0, 16);
  display.printf("%.1f", temp);
  display.setTextSize(1);
  display.print(" C");

  // Humidity
  display.setTextSize(1);
  display.setCursor(0, 38);
  display.printf("Humidity: %.1f %%", humidity);

  // Pressure
  display.setCursor(0, 50);
  display.printf("Pressure: %.0f hPa", pressure);

  display.display();
  delay(2000);
}
The display now shows temperature in a large font with humidity and pressure below. The 128x64 pixel screen is small, but this layout keeps everything readable.
Step 3: The Complete WiFi Web Dashboard
This is the full project — sensor reading, OLED display, web server, trend graph, data logging, and weather prediction all in one sketch.
#include <WiFi.h>
#include <WebServer.h>
#include <Wire.h>
#include <Adafruit_Sensor.h>
#include <Adafruit_BME280.h>
#include <Adafruit_GFX.h>
#include <Adafruit_SSD1306.h>
#include <LittleFS.h>
#include <time.h>

// ---- CONFIGURATION ----
const char* ssid     = "YOUR_WIFI_SSID";
const char* password = "YOUR_WIFI_PASSWORD";

#define SCREEN_WIDTH 128
#define SCREEN_HEIGHT 64
#define OLED_RESET -1
#define SEA_LEVEL_PRESSURE_HPA 1013.25
#define MAX_HISTORY 96  // 96 readings * 15 min = 24 hours
#define LOG_INTERVAL 900000  // 15 minutes in milliseconds

// ---- GLOBALS ----
Adafruit_SSD1306 display(SCREEN_WIDTH, SCREEN_HEIGHT, &Wire, OLED_RESET);
Adafruit_BME280 bme;
WebServer server(80);

float temperature = 0, humidity = 0, pressure = 0, altitude = 0;
float tempHistory[MAX_HISTORY];
float pressHistory[MAX_HISTORY];
int historyIndex = 0;
int historyCount = 0;
unsigned long lastLogTime = 0;
unsigned long lastReadTime = 0;
String weatherForecast = "Stable";

// ---- SETUP ----
void setup() {
  Serial.begin(115200);

  // Initialize LittleFS
  if (!LittleFS.begin(true)) {
    Serial.println("LittleFS mount failed");
  }

  // Initialize display
  if (!display.begin(SSD1306_SWITCHCAPVCC, 0x3C)) {
    Serial.println("SSD1306 failed");
    while (1) delay(10);
  }
  display.clearDisplay();
  display.setTextSize(1);
  display.setTextColor(SSD1306_WHITE);
  display.setCursor(10, 28);
  display.print("Connecting WiFi...");
  display.display();

  // Initialize BME280
  if (!bme.begin(0x76)) {
    Serial.println("BME280 not found!");
    while (1) delay(10);
  }

  // Configure BME280 for weather monitoring
  bme.setSampling(Adafruit_BME280::MODE_NORMAL,
                  Adafruit_BME280::SAMPLING_X2,   // temperature
                  Adafruit_BME280::SAMPLING_X16,  // pressure
                  Adafruit_BME280::SAMPLING_X1,   // humidity
                  Adafruit_BME280::FILTER_X16,
                  Adafruit_BME280::STANDBY_MS_500);

  // Connect to WiFi
  WiFi.begin(ssid, password);
  int attempts = 0;
  while (WiFi.status() != WL_CONNECTED && attempts < 40) {
    delay(500);
    Serial.print(".");
    attempts++;
  }

  if (WiFi.status() == WL_CONNECTED) {
    Serial.printf("\nConnected! IP: %s\n", WiFi.localIP().toString().c_str());
  } else {
    Serial.println("\nWiFi connection failed. Web dashboard unavailable.");
  }

  // Load saved history from LittleFS
  loadHistory();

  // Set up web server routes
  server.on("/", handleRoot);
  server.on("/api/data", handleData);
  server.begin();

  // Take initial reading
  readSensors();
}

// ---- SENSOR READING ----
void readSensors() {
  temperature = bme.readTemperature();
  humidity    = bme.readHumidity();
  pressure    = bme.readPressure() / 100.0F;
  altitude    = 44330.0 * (1.0 - pow(pressure / SEA_LEVEL_PRESSURE_HPA, 0.1903));
}

// ---- WEATHER PREDICTION ----
void predictWeather() {
  if (historyCount < 4) {
    weatherForecast = "Collecting data...";
    return;
  }

  // Compare current pressure to 3 hours ago (12 readings * 15 min)
  int oldIndex = historyIndex - 12;
  if (oldIndex < 0) oldIndex += MAX_HISTORY;

  if (historyCount < 12) {
    oldIndex = 0;  // Use oldest available reading
  }

  float pressureDiff = pressure - pressHistory[oldIndex];

  if (pressureDiff > 2.0) {
    weatherForecast = "Fair weather ahead";
  } else if (pressureDiff > 0.5) {
    weatherForecast = "Conditions improving";
  } else if (pressureDiff < -2.0) {
    weatherForecast = "Rain likely";
  } else if (pressureDiff < -0.5) {
    weatherForecast = "Conditions declining";
  } else {
    weatherForecast = "Stable conditions";
  }
}

// ---- DATA LOGGING ----
void logReading() {
  tempHistory[historyIndex]  = temperature;
  pressHistory[historyIndex] = pressure;
  historyIndex = (historyIndex + 1) % MAX_HISTORY;
  if (historyCount < MAX_HISTORY) historyCount++;

  predictWeather();
  saveHistory();
}

void saveHistory() {
  File file = LittleFS.open("/weather_log.dat", "w");
  if (!file) return;

  file.write((uint8_t*)&historyIndex, sizeof(historyIndex));
  file.write((uint8_t*)&historyCount, sizeof(historyCount));
  file.write((uint8_t*)tempHistory, sizeof(tempHistory));
  file.write((uint8_t*)pressHistory, sizeof(pressHistory));
  file.close();
}

void loadHistory() {
  File file = LittleFS.open("/weather_log.dat", "r");
  if (!file) return;

  file.read((uint8_t*)&historyIndex, sizeof(historyIndex));
  file.read((uint8_t*)&historyCount, sizeof(historyCount));
  file.read((uint8_t*)tempHistory, sizeof(tempHistory));
  file.read((uint8_t*)pressHistory, sizeof(pressHistory));
  file.close();
  Serial.printf("Loaded %d history entries\n", historyCount);
}

// ---- OLED DISPLAY ----
void updateDisplay() {
  display.clearDisplay();

  // Header
  display.setTextSize(1);
  display.setCursor(4, 0);
  display.print("WAVTRON WEATHER STN");
  display.drawLine(0, 10, 128, 10, SSD1306_WHITE);

  // Temperature (large)
  display.setTextSize(2);
  display.setCursor(0, 14);
  display.printf("%.1f", temperature);
  display.setTextSize(1);
  display.setCursor(display.getCursorX(), 14);
  display.print(" o");
  display.setCursor(display.getCursorX(), 20);
  display.print("C");

  // Humidity icon area
  display.setTextSize(1);
  display.setCursor(85, 14);
  display.printf("%.0f%%", humidity);
  display.setCursor(85, 24);
  display.print("RH");

  // Divider
  display.drawLine(0, 34, 128, 34, SSD1306_WHITE);

  // Pressure and altitude
  display.setCursor(0, 38);
  display.printf("P: %.0f hPa", pressure);
  display.setCursor(0, 48);
  display.printf("Alt: %.0f m", altitude);

  // WiFi status and IP
  display.setCursor(0, 56);
  if (WiFi.status() == WL_CONNECTED) {
    display.print(WiFi.localIP().toString());
  } else {
    display.print("WiFi: Disconnected");
  }

  display.display();
}

// ---- WEB SERVER HANDLERS ----
void handleData() {
  String json = "{";
  json += "\"temperature\":" + String(temperature, 1) + ",";
  json += "\"humidity\":" + String(humidity, 1) + ",";
  json += "\"pressure\":" + String(pressure, 1) + ",";
  json += "\"altitude\":" + String(altitude, 1) + ",";
  json += "\"forecast\":\"" + weatherForecast + "\",";
  json += "\"tempHistory\":[";
  for (int i = 0; i < historyCount; i++) {
    int idx = (historyIndex - historyCount + i + MAX_HISTORY) % MAX_HISTORY;
    if (i > 0) json += ",";
    json += String(tempHistory[idx], 1);
  }
  json += "],\"pressHistory\":[";
  for (int i = 0; i < historyCount; i++) {
    int idx = (historyIndex - historyCount + i + MAX_HISTORY) % MAX_HISTORY;
    if (i > 0) json += ",";
    json += String(pressHistory[idx], 1);
  }
  json += "]}";

  server.send(200, "application/json", json);
}

void handleRoot() {
  String html = R"rawliteral(
<!DOCTYPE html>
<html lang="en">
<head>
  <meta charset="UTF-8">
  <meta name="viewport" content="width=device-width, initial-scale=1.0">
  <title>Weather Station</title>
  <style>
    * { margin: 0; padding: 0; box-sizing: border-box; }
    body {
      font-family: -apple-system, BlinkMacSystemFont, 'Segoe UI', sans-serif;
      background: #0F1A2E; color: #f1f5f9;
    }
    .container { max-width: 600px; margin: 0 auto; padding: 16px; }
    h1 { font-size: 1.4rem; text-align: center; margin: 16px 0;
         color: #FF6B35; }
    .cards { display: grid; grid-template-columns: 1fr 1fr; gap: 12px;
             margin-bottom: 16px; }
    .card {
      background: #1a2744; border-radius: 12px; padding: 16px;
      text-align: center; border: 1px solid rgba(255,255,255,0.08);
    }
    .card.full { grid-column: 1 / -1; }
    .value { font-size: 2rem; font-weight: 700; color: #FF6B35; }
    .label { font-size: 0.75rem; color: rgba(255,255,255,0.5);
             text-transform: uppercase; letter-spacing: 0.05em;
             margin-top: 4px; }
    .unit { font-size: 0.9rem; font-weight: 400;
            color: rgba(255,255,255,0.6); }
    .forecast {
      text-align: center; padding: 12px; border-radius: 12px;
      background: #1a2744; margin-bottom: 16px;
      border: 1px solid rgba(255,255,255,0.08);
    }
    .forecast-text { font-size: 1rem; font-weight: 600; }
    canvas {
      width: 100%; height: 200px; background: #1a2744;
      border-radius: 12px; border: 1px solid rgba(255,255,255,0.08);
    }
    .chart-title {
      font-size: 0.85rem; color: rgba(255,255,255,0.6);
      margin: 16px 0 8px 0;
    }
    .updated { text-align: center; font-size: 0.7rem;
               color: rgba(255,255,255,0.3); margin-top: 16px; }
  </style>
</head>
<body>
  <div class="container">
    <h1>Weather Station</h1>
    <div class="cards">
      <div class="card">
        <div class="value" id="temp">--</div>
        <div class="label">Temperature</div>
      </div>
      <div class="card">
        <div class="value" id="hum">--</div>
        <div class="label">Humidity</div>
      </div>
      <div class="card">
        <div class="value" id="pres">--</div>
        <div class="label">Pressure</div>
      </div>
      <div class="card">
        <div class="value" id="alt">--</div>
        <div class="label">Altitude</div>
      </div>
    </div>
    <div class="forecast">
      <div class="label">Forecast</div>
      <div class="forecast-text" id="forecast">--</div>
    </div>
    <div class="chart-title">Temperature Trend (24h)</div>
    <canvas id="tempChart"></canvas>
    <div class="chart-title">Pressure Trend (24h)</div>
    <canvas id="pressChart"></canvas>
    <div class="updated" id="updated"></div>
  </div>
  <script>
    function drawChart(canvasId, data, color, unitLabel) {
      const canvas = document.getElementById(canvasId);
      const ctx = canvas.getContext('2d');
      canvas.width = canvas.offsetWidth * 2;
      canvas.height = 400;
      ctx.clearRect(0, 0, canvas.width, canvas.height);

      if (data.length < 2) {
        ctx.fillStyle = 'rgba(255,255,255,0.3)';
        ctx.font = '24px sans-serif';
        ctx.textAlign = 'center';
        ctx.fillText('Collecting data...', canvas.width/2, 200);
        return;
      }

      const pad = { top: 30, right: 20, bottom: 30, left: 60 };
      const w = canvas.width - pad.left - pad.right;
      const h = canvas.height - pad.top - pad.bottom;
      const min = Math.min(...data) - 1;
      const max = Math.max(...data) + 1;

      // Grid lines
      ctx.strokeStyle = 'rgba(255,255,255,0.06)';
      ctx.lineWidth = 1;
      for (let i = 0; i <= 4; i++) {
        const y = pad.top + (h / 4) * i;
        ctx.beginPath(); ctx.moveTo(pad.left, y);
        ctx.lineTo(pad.left + w, y); ctx.stroke();
        ctx.fillStyle = 'rgba(255,255,255,0.35)';
        ctx.font = '20px sans-serif'; ctx.textAlign = 'right';
        const val = max - ((max - min) / 4) * i;
        ctx.fillText(val.toFixed(1) + unitLabel, pad.left - 8, y + 6);
      }

      // Line
      ctx.beginPath();
      ctx.strokeStyle = color;
      ctx.lineWidth = 3;
      ctx.lineJoin = 'round';
      data.forEach((val, i) => {
        const x = pad.left + (i / (data.length - 1)) * w;
        const y = pad.top + h - ((val - min) / (max - min)) * h;
        i === 0 ? ctx.moveTo(x, y) : ctx.lineTo(x, y);
      });
      ctx.stroke();

      // Fill
      const lastX = pad.left + w;
      const baseY = pad.top + h;
      ctx.lineTo(lastX, baseY);
      ctx.lineTo(pad.left, baseY);
      ctx.closePath();
      ctx.fillStyle = color.replace('1)', '0.1)');
      ctx.fill();
    }

    function fetchData() {
      fetch('/api/data')
        .then(r => r.json())
        .then(d => {
          document.getElementById('temp').innerHTML =
            d.temperature.toFixed(1) + '<span class="unit"> C</span>';
          document.getElementById('hum').innerHTML =
            d.humidity.toFixed(1) + '<span class="unit"> %</span>';
          document.getElementById('pres').innerHTML =
            d.pressure.toFixed(0) + '<span class="unit"> hPa</span>';
          document.getElementById('alt').innerHTML =
            d.altitude.toFixed(0) + '<span class="unit"> m</span>';
          document.getElementById('forecast').textContent = d.forecast;
          document.getElementById('updated').textContent =
            'Updated: ' + new Date().toLocaleTimeString();
          drawChart('tempChart', d.tempHistory,
                    'rgba(255, 107, 53, 1)', ' C');
          drawChart('pressChart', d.pressHistory,
                    'rgba(30, 58, 95, 1)', '');
        })
        .catch(e => console.error('Fetch error:', e));
    }

    fetchData();
    setInterval(fetchData, 10000); // Refresh every 10 seconds
  </script>
</body>
</html>
)rawliteral";

  server.send(200, "text/html", html);
}

// ---- MAIN LOOP ----
void loop() {
  server.handleClient();

  // Read sensors every 2 seconds
  if (millis() - lastReadTime >= 2000) {
    readSensors();
    updateDisplay();
    lastReadTime = millis();
  }

  // Log data every 15 minutes
  if (millis() - lastLogTime >= LOG_INTERVAL) {
    logReading();
    lastLogTime = millis();
    Serial.printf("Logged: %.1fC, %.1f%%, %.1f hPa\n",
                  temperature, humidity, pressure);
  }
}
Upload this sketch to your ESP32 (make sure to update YOUR_WIFI_SSID and YOUR_WIFI_PASSWORD). Once connected, the Serial Monitor will print the assigned IP address. Open that address in any browser on the same network and you will see the live dashboard.
Understanding Altitude Calculation
You may have noticed this line in the code:
altitude = 44330.0 * (1.0 - pow(pressure / SEA_LEVEL_PRESSURE_HPA, 0.1903));
This is the barometric formula (also called the hypsometric formula). It estimates your altitude above sea level based on the current atmospheric pressure and a reference sea level pressure. Here is how it works:
- At sea level, standard atmospheric pressure is 1013.25 hPa
- For every 8.4 meters you go up, pressure drops by approximately 1 hPa
- The relationship is not perfectly linear, which is why we use the exponential formula
To get accurate altitude readings, you need to calibrate SEA_LEVEL_PRESSURE_HPA to the current sea level pressure at your location. You can find this from your local weather service or airport METAR reports. If you are in a coastal city like Mumbai or Chennai, 1013.25 is usually close enough.
Weather Prediction from Pressure Trends
Barometric pressure is one of the oldest and most reliable indicators of upcoming weather. The prediction logic in our code is straightforward:
| Pressure Change (3 hours) | Interpretation | Typical Weather |
|---|---|---|
| Rising > 2 hPa | Rapidly rising | Fair, clear skies ahead |
| Rising 0.5 - 2 hPa | Slowly rising | Conditions improving |
| Steady (-0.5 to +0.5 hPa) | Stable | No significant change |
| Falling 0.5 - 2 hPa | Slowly falling | Conditions deteriorating |
| Falling > 2 hPa | Rapidly falling | Rain or storm likely |
This is a simplified model. Professional weather stations combine pressure trends with humidity, temperature changes, and wind data for better predictions. But for a home station, this gives you a surprisingly useful heads-up about incoming weather — especially during the monsoon season.
Data Logging to LittleFS
The ESP32 has 4 MB of flash memory, and a portion of it can be used as a filesystem. We use LittleFS (which replaced the older SPIFFS) to store our weather readings.
Our code stores up to 96 readings (24 hours at 15-minute intervals) in a binary file. Each reading consists of a temperature and pressure float, so the total storage is roughly:
96 readings * 2 floats * 4 bytes = 768 bytes
That is negligible. You could easily expand this to store weeks of data. A few things to keep in mind:
- Flash wear: Flash memory has a limited number of write cycles (around 10,000 to 100,000). Writing every 15 minutes means roughly 35,000 writes per year. This is within limits, but if you want to log every minute, consider writing to an SD card instead.
- Power loss: LittleFS is crash-safe, so partial writes will not corrupt your filesystem. However, any data not yet saved will be lost if power is interrupted.
- NTP time: For timestamp-based logging, add NTP synchronization by including
configTime(19800, 0, "pool.ntp.org")in setup (19800 is the IST offset in seconds).
Power Options
USB Power (Simplest)
Plug the ESP32 into any USB power adapter or power bank. The ESP32 with BME280 and OLED draws approximately 80-120 mA during normal operation with WiFi active. Any standard phone charger will work.
Battery Power
For a portable or outdoor station, use a 3.7V lithium-ion (18650) battery connected to the ESP32's battery input (if your board has one) or through a TP4056 charging module.
Battery life estimate with a 2600mAh 18650:
- WiFi always on: approximately 20-24 hours
- WiFi in deep sleep (wake every 5 min): approximately 7-10 days
- Deep sleep with no WiFi: weeks
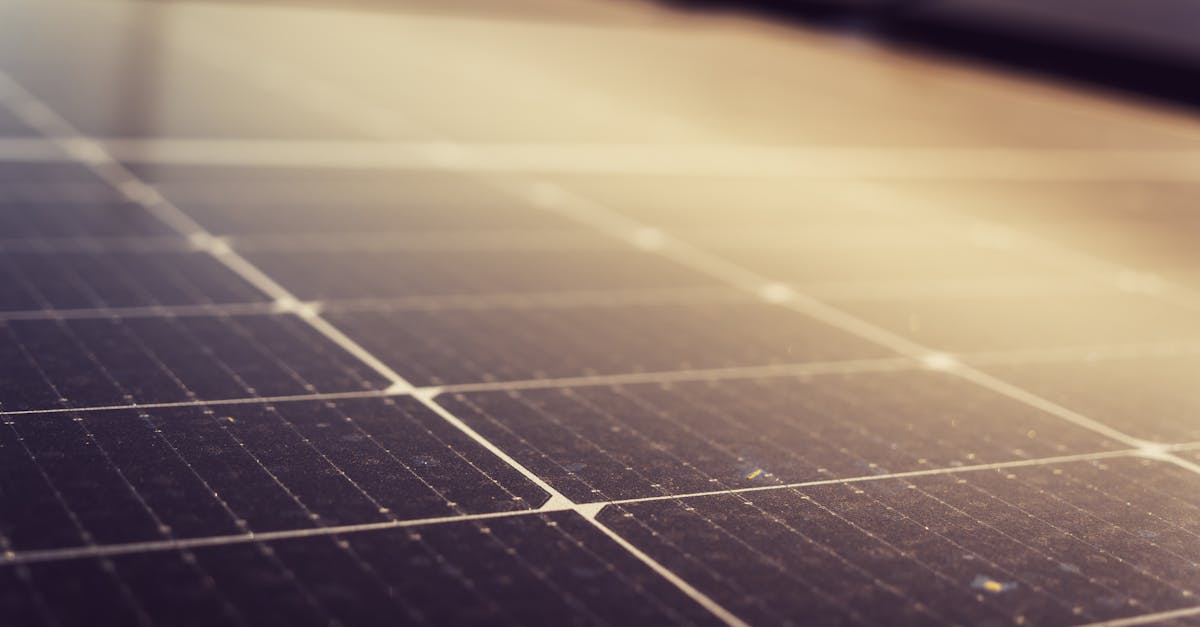
Solar Power
For a truly autonomous weather station, add a 6V 1W mini solar panel connected to the TP4056 module. This combination can keep an 18650 battery topped up indefinitely in most Indian cities, especially during summer months when you get 6-8 hours of strong sunlight.
Recommended deep sleep configuration for solar builds:
// At the end of loop(), instead of continuous operation:
esp_sleep_enable_timer_wakeup(300 * 1000000); // Wake every 5 minutes
esp_deep_sleep_start();
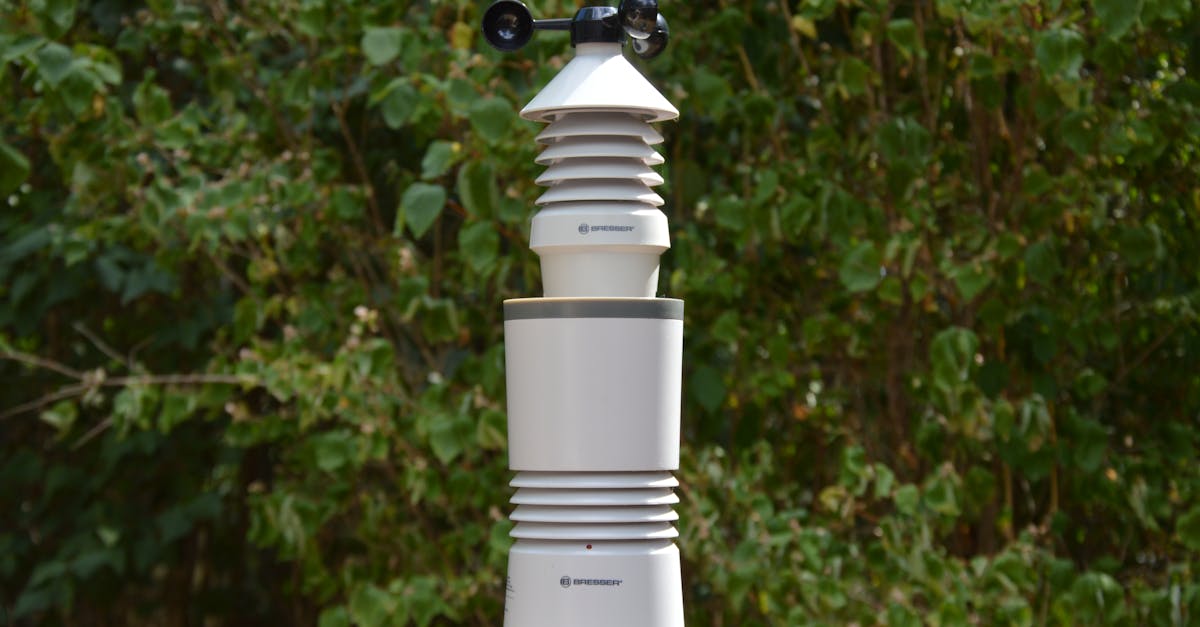
Building an Enclosure
For outdoor deployment, you need to protect the electronics while allowing the BME280 sensor to be exposed to ambient air.
Key principles:
- Ventilation: The BME280 must breathe. Do not seal it inside a closed box or your readings will be wrong. Use a Stevenson screen design — a louvered enclosure that allows airflow while blocking direct sunlight and rain.
- Sun shielding: Direct sunlight on the sensor will give artificially high temperature readings. The enclosure must shade the sensor.
- Rain protection: Orient openings downward or use baffles to prevent rain from reaching the electronics.
- Material: A small plastic food container (like a takeaway container) with holes drilled in the sides works surprisingly well for prototyping. For a more permanent solution, 3D print a radiation shield.
Simple DIY approach: Stack 3-4 plastic plates or saucers with spacers (small bolts and nuts) between them. Mount the BME280 inside this stack. The overlapping plates block sun and rain while the gaps allow air to flow through. Mount the stack on a pole or wall bracket, north-facing if possible (in India, this minimizes direct sun exposure).
Extending the Project
Once your basic weather station is running, here are several ways to expand it.
Add a Rain Gauge
A tipping bucket rain gauge connects to a GPIO pin as a simple digital interrupt. Each tip represents a fixed volume of rainfall (typically 0.2 mm). Count the tips over time to measure rainfall intensity and accumulation.
Add a Wind Speed Sensor (Anemometer)
A basic cup anemometer outputs pulses proportional to wind speed. Connect to a GPIO pin with an interrupt and count pulses per second. Three cups with a reed switch and magnet is a common DIY design.
Connect to ThingSpeak
ThingSpeak is a free IoT analytics platform. Add this to your loop to push data to the cloud:
#include <HTTPClient.h>

void sendToThingSpeak() {
  if (WiFi.status() != WL_CONNECTED) return;

  HTTPClient http;
  String url = "http://api.thingspeak.com/update?api_key=YOUR_API_KEY";
  url += "&field1=" + String(temperature);
  url += "&field2=" + String(humidity);
  url += "&field3=" + String(pressure);

  http.begin(url);
  int httpCode = http.GET();
  http.end();
}
Call sendToThingSpeak() every 15-20 seconds (ThingSpeak's free tier rate limit).
Add MQTT for Home Automation
If you run Home Assistant or Node-RED, publish readings over MQTT:
#include <PubSubClient.h>

WiFiClient espClient;
PubSubClient mqtt(espClient);

void publishMQTT() {
  if (!mqtt.connected()) {
    mqtt.connect("weather-station");
  }
  mqtt.publish("weather/temperature", String(temperature).c_str());
  mqtt.publish("weather/humidity", String(humidity).c_str());
  mqtt.publish("weather/pressure", String(pressure).c_str());
}
This lets you integrate your weather data into dashboards, automations, and notifications.
Add More Sensors
- BH1750 for ambient light / UV index measurement
- MQ-135 for air quality (CO2, ammonia, benzene)
- ML8511 for UV intensity
- Rain drop sensor module for simple wet/dry detection
All of these are available at wavtron.in and most communicate over I2C or analog, making them easy to add to the existing setup.
Troubleshooting
| Problem | Solution |
|---|---|
| BME280 not detected | Check wiring. Try address 0x77 instead of 0x76. Run an I2C scanner sketch. |
| OLED shows nothing | Verify the I2C address is 0x3C (some modules use 0x3D). Check VCC is 3.3V. |
| Readings seem wrong | Make sure you have a BME280, not a BMP280. Check the sensor is not near heat sources. |
| WiFi keeps disconnecting | Add a reconnection check in loop(). Ensure your router is within range. |
| Web page loads slowly | The HTML is served from flash. This is normal for ESP32 — first load takes 1-2 seconds. |
| Temperature reads high | The ESP32 itself generates heat. Mount the BME280 away from the board on extended wires. |
Wrapping Up
For under ₹1,000 and a couple of hours of work, you now have a fully functional WiFi weather station. It reads temperature, humidity, and pressure, displays live data on an OLED, serves a web dashboard with trend graphs, logs data locally, and even makes simple weather predictions.
The beauty of building your own is that you can customize everything. Add more sensors. Push data to the cloud. Build a beautiful enclosure. Connect it to your home automation system. Set up alerts for extreme temperatures. The ESP32 has enough processing power and memory to handle all of this and more.
All components used in this project are available at wavtron.in. If you build this project, we would love to see your setup.
Happy building.